Look at the stock 386 Sinopec. The first graph shows the stock price candles dance along the Bollinger Bands (保力加通道). The price has gone above the upper band, closing at $ 6.45 today (8 April 2010) whereas on STC (the second graph) the blue line, at 77.42, has come down below the red one of 80.54. Momentum of RSI (the third graph) dissipated. A larger correction is imminent. So I think we may take advantage of this situation buying a put warrant - 18412 Sinopec - Rabobank put, expiring 21 September (plenty of time!). Leverage at 8.165x with strike price at $ 6.59. The put warrant closed at $0.079, up 6.8% compared with the previous day. But we need to look at the trading volume before jumping in (today 14.3 m shares traded, not bad but need to keep an eye on it).
Source: ET Net Hong Kong. 386 Sinopec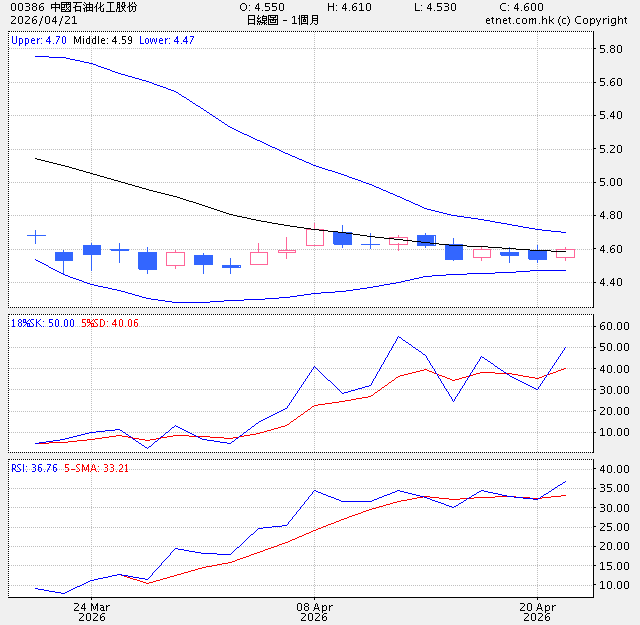
Source: ET Net Hong Kong;
18412 Rabobank-Sinopec Put
No comments:
Post a Comment